8-21
1 Node一些常用库
遇到的Node常用库集合
| 库名 | 描述 | 例子 |
|---|---|---|
| minimist | 解析命令行 | node example/parse.js -a beep -b boop =>> { _: [], a: 'beep', b: 'boop' } |
| fs-extra | 原生fs模块的扩展库 | fs.existsSync(path) --判断路径是否存在 |
| cross-spawn | 一个跨平台执行命令的工具 | spawn('npm', ['install', 'react', '-g']) --安装react |
| chalk | 带颜色的终端输出日志 | console.log(chalk.blue('Hello world!')) |
2 Highcharts
实例
TODO
自定义样式
https://www.highcharts.com/docs/chart-design-and-style/design-and-style
标记
https://jshare.com.cn/highcharts/VSK8A3
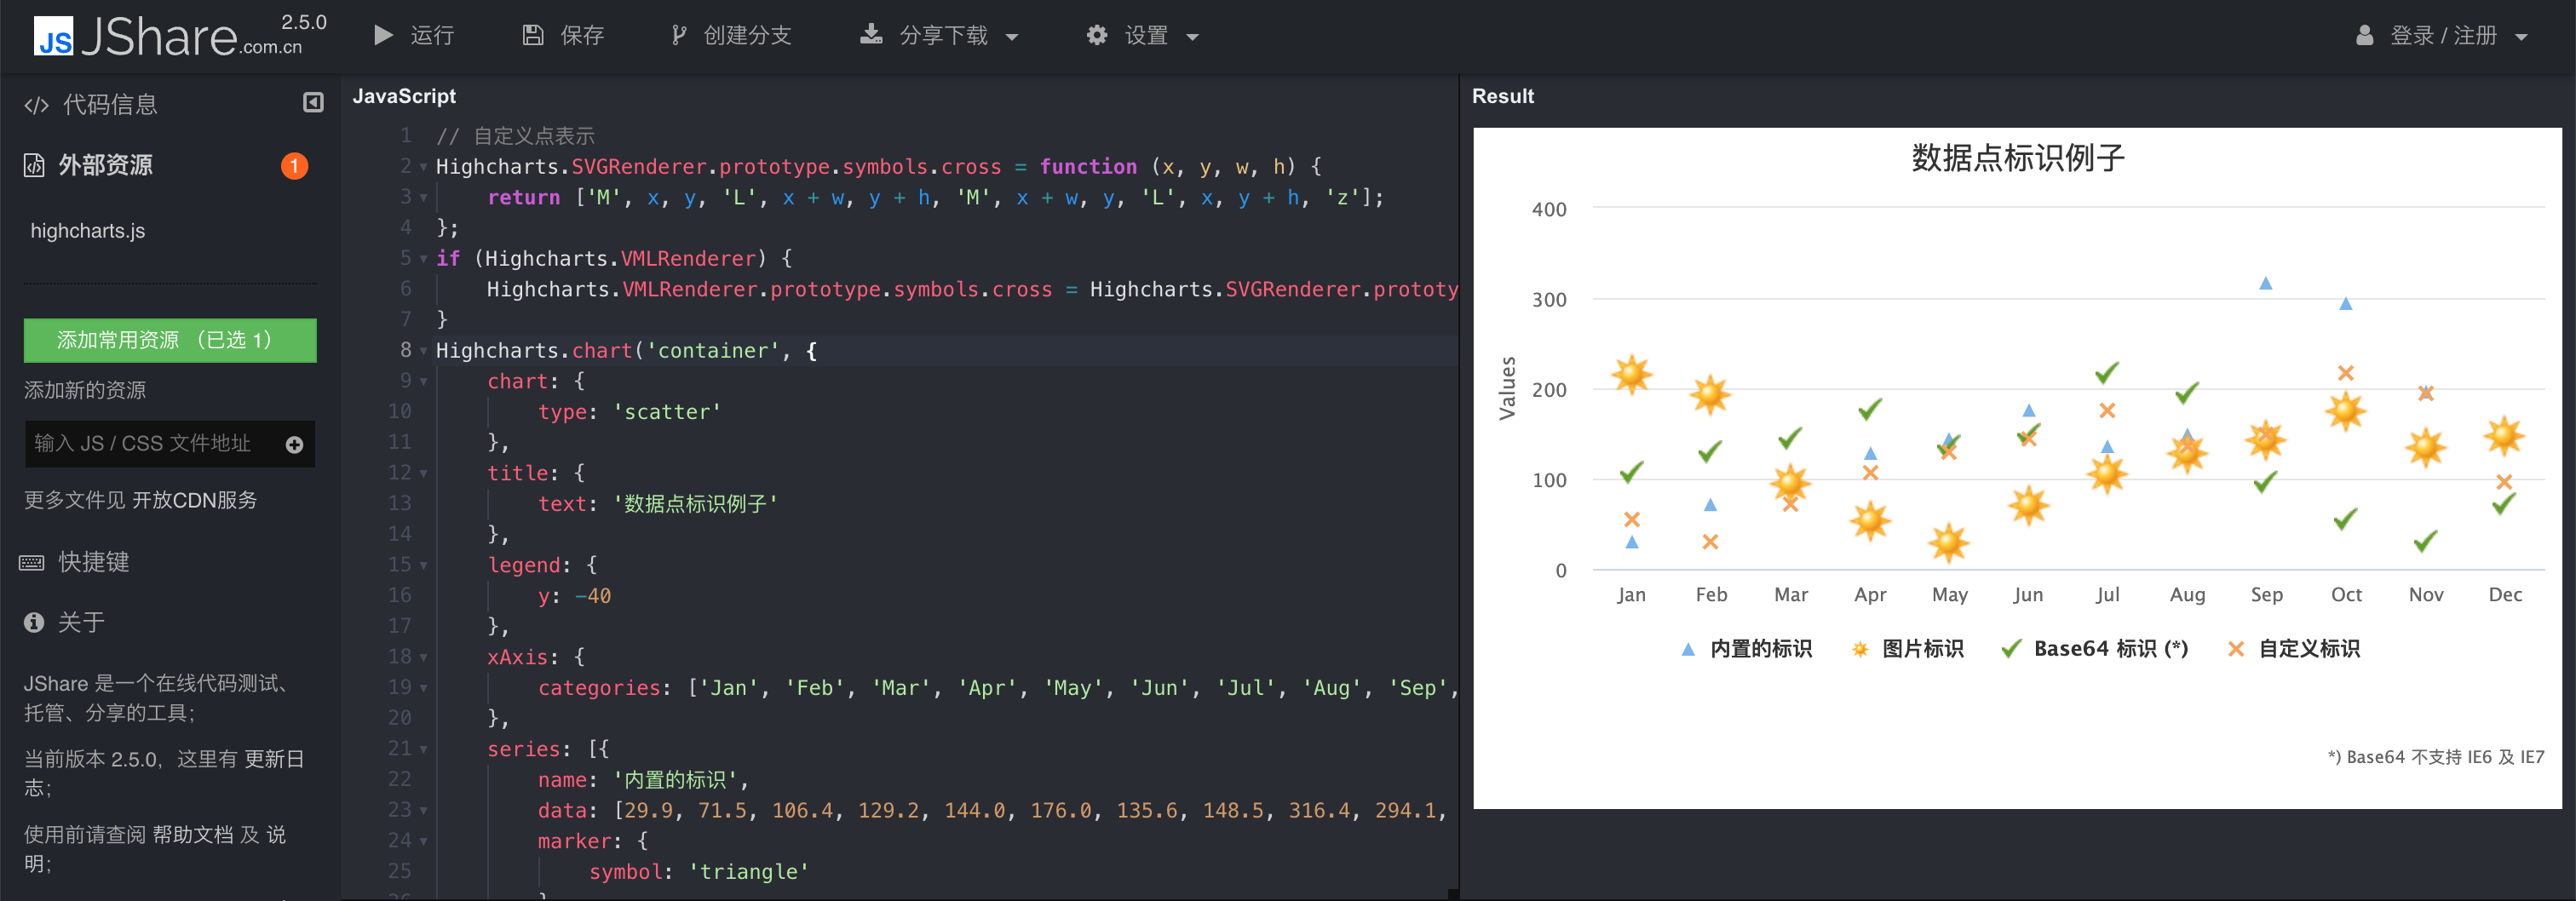
关键
设置series中的marker.symbol
{
  series: [{
    name: '内置的标识',
    data: [29.9, 71.5, 106.4, 129.2, 144.0, 176.0, 135.6, 148.5, 316.4, 294.1, 195.6, 154.4],
    marker: {
      symbol: 'triangle'
    }
  }, {
    name: '图片标识',
    data: [216.4, 194.1, 95.6, 54.4, 29.9, 71.5, 106.4, 129.2, 144.0, 176.0, 135.6, 148.5],
    marker: {
      symbol: 'url(https://www.highcharts.com/samples/graphics/sun.png)'
    }
  }]
}
混合图
https://www.highcharts.com.cn/demo/highcharts/combo
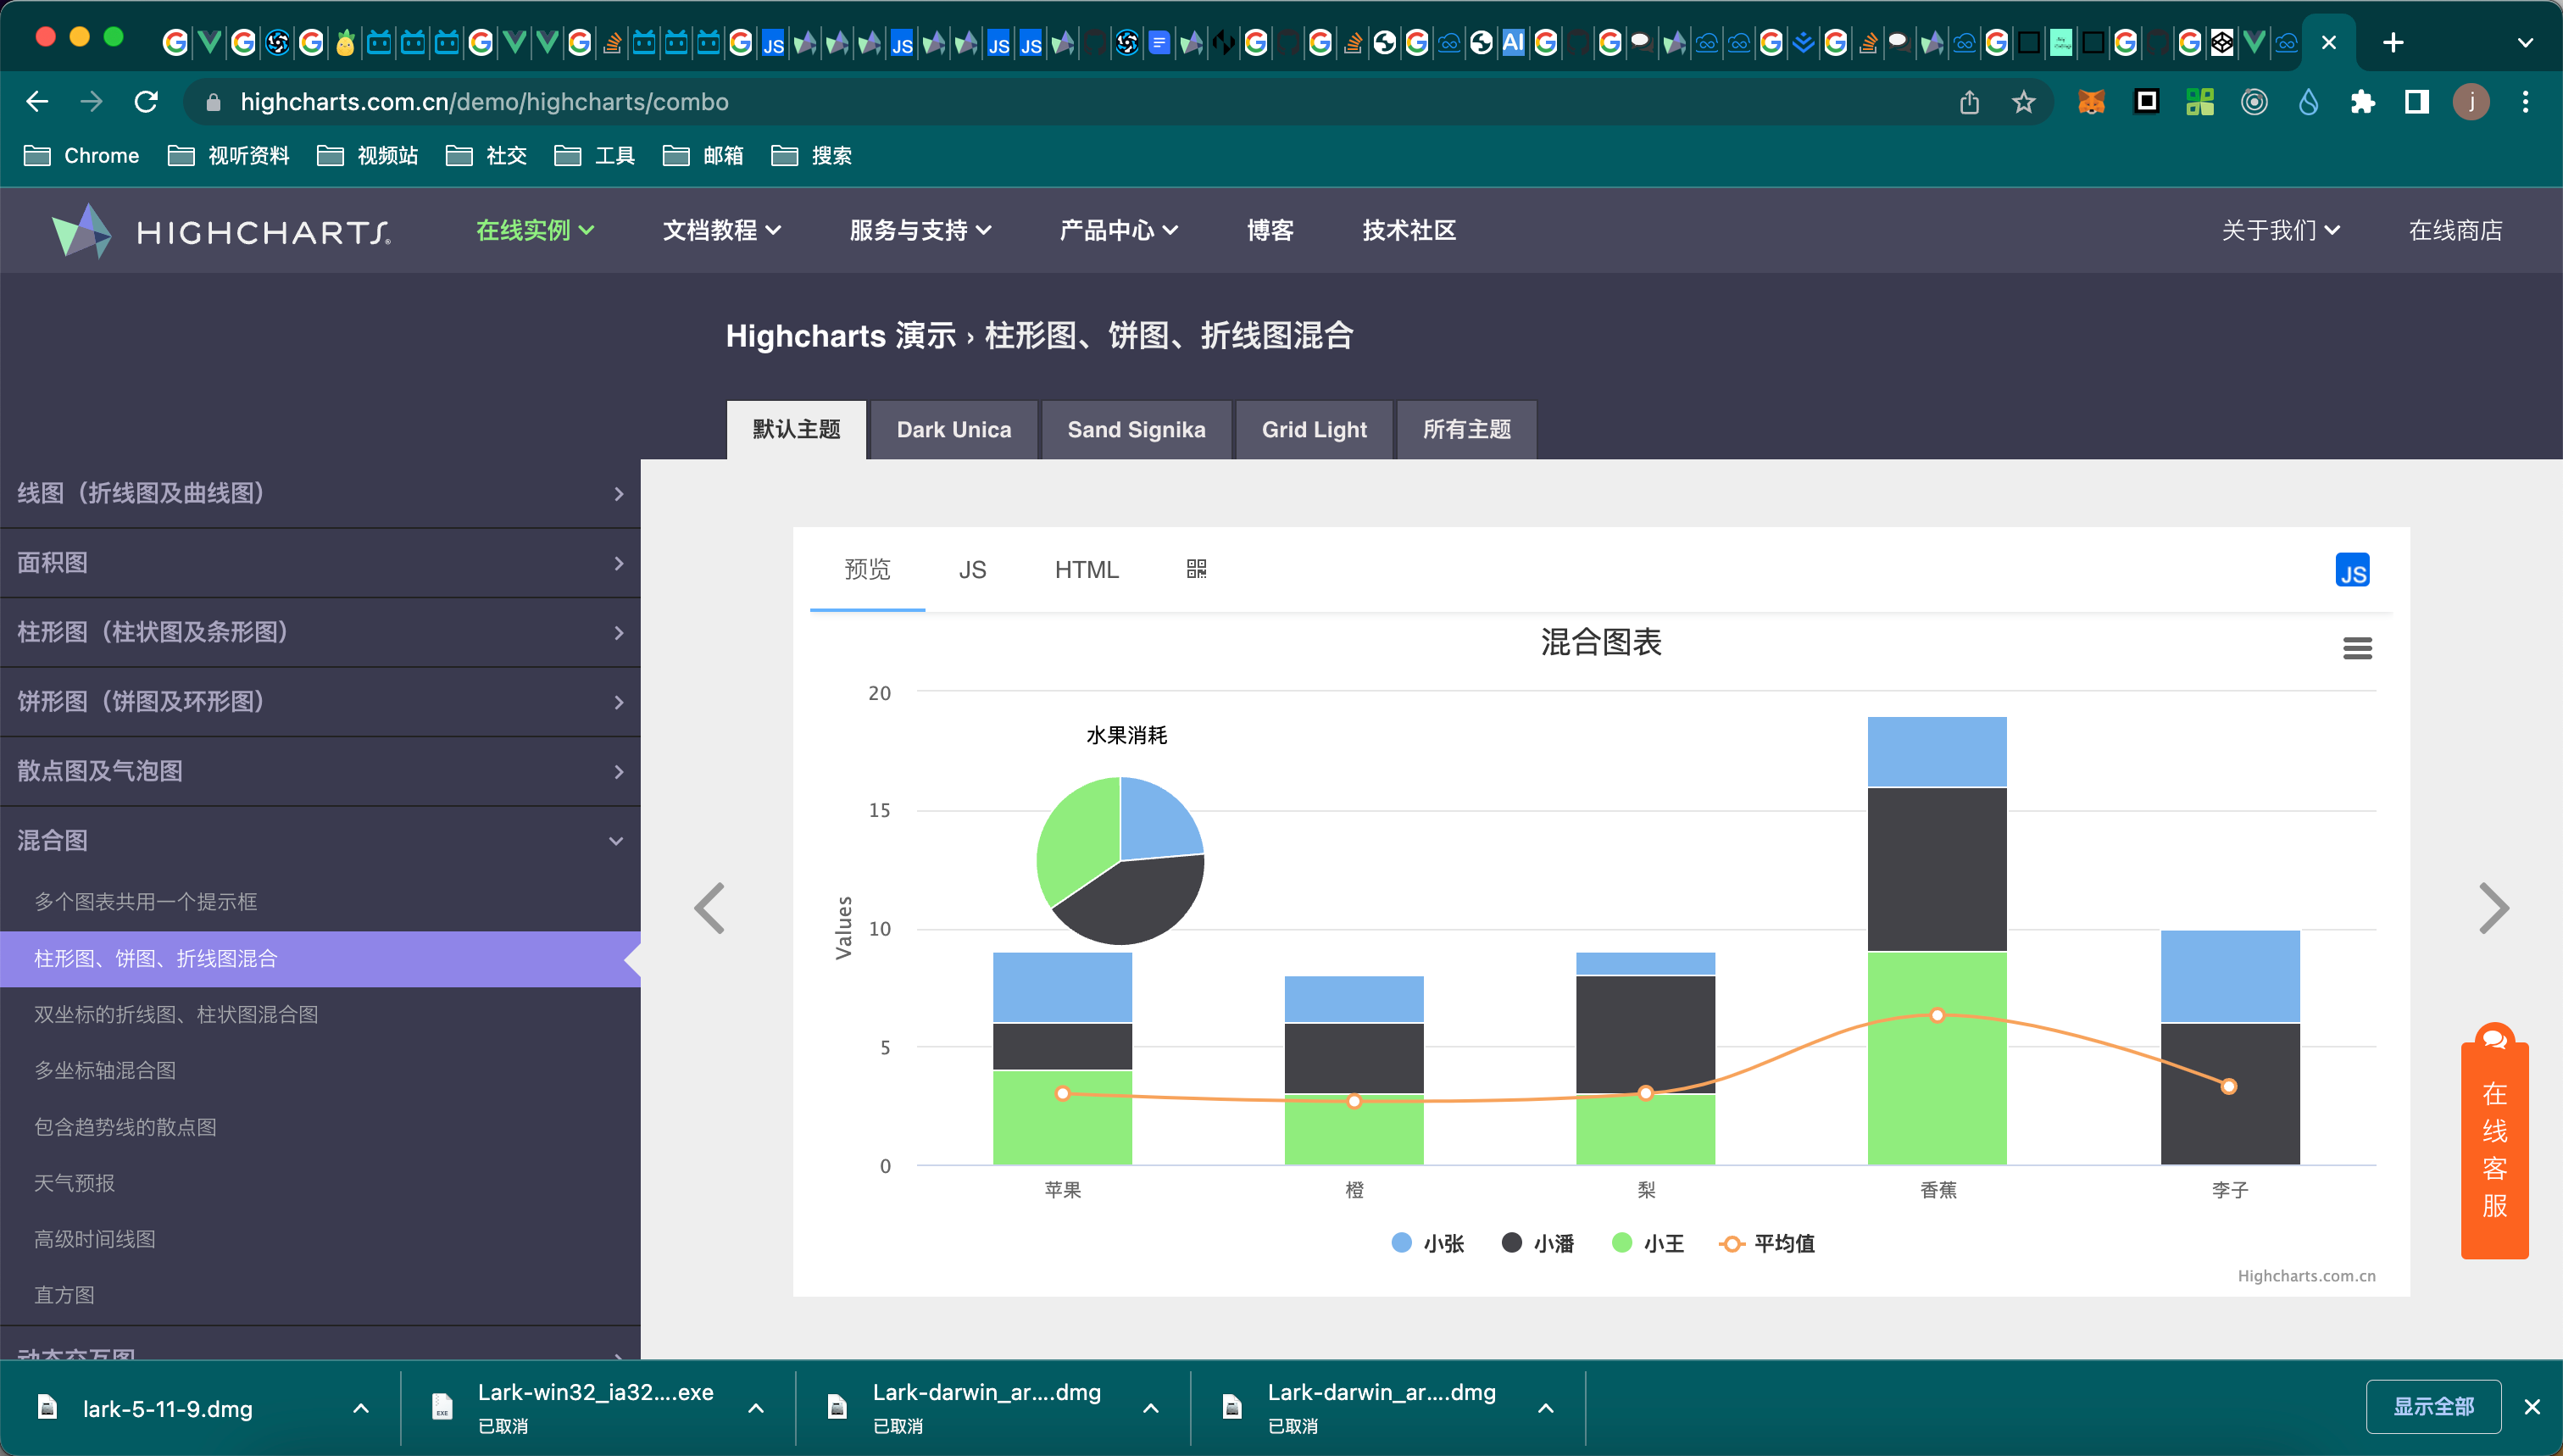
关键
多个series
series: [{
        type: 'column',
        name: '小张',
        data: [3, 2, 1, 3, 4]
    }, {
        type: 'column',
        name: '小潘',
        data: [2, 3, 5, 7, 6]
    }, {
        type: 'column',
        name: '小王',
        data: [4, 3, 3, 9, 0]
    }, {
        type: 'spline',
        name: '平均值',
        data: [3, 2.67, 3, 6.33, 3.33],
        marker: {
            lineWidth: 2,
            lineColor: Highcharts.getOptions().colors[3],
            fillColor: 'white'
        }
    }, {
        type: 'pie',
        name: '总的消耗',
        data: [{
            name: '小张',
            y: 13,
            color: Highcharts.getOptions().colors[0] // Jane's color
        }, {
            name: '小潘',
            y: 23,
            color: Highcharts.getOptions().colors[1] // John's color
        }, {
            name: '小王',
            y: 19,
            color: Highcharts.getOptions().colors[2] // Joe's color
        }],
        center: [100, 80],
        size: 100,
        showInLegend: false,
        dataLabels: {
            enabled: false
        }
    }]
多个y轴共用一个x轴
https://jsfiddle.net/BlackLabel/mnr513La/

关键
合理使用y轴的height和top属性
{
  yAxis: [{
    title: {
      text: 'Pressure'
    },
    height: '50%',  // <== 关键点
    lineWidth: 2
  }, {
    title: {
      text: 'Temperature'
    },
    top: '50%',         // <== 关键点
    height: '50%',  // <== 关键点
    offset: 0,
    lineWidth: 2
  }]
}
问题一:如何更新数据?
方式一:使用highcharts-vue
如果使用 highcharts-vue,则只需要更改options,则会自动更新
this.chartOptions.series[0].data = data.newData;
示例:https://codesandbox.io/s/nw750l07nj?file=/src/components/Chart.vue:640-688
方式二:series.update
https://stackoverflow.com/questions/16407901/highchart-series-update-in-javascript
chart.series[0].update({
  pointStart: newSeries[0].pointStart,
  data: newSeries[0].data
}, true); //true / false to redraw
问题二:如何格式化 x 轴的时间?
xAxis: {
  crosshair: true,
  type: 'datetime',
  min: xAxisDatas.value[0],
  max: xAxisDatas.value[xAxisDatas.value.length - 1],
  dateTimeLabelFormats: {
    millisecond: '%H:%M:%S.%L', // 如果时间轴以毫秒秒为单位,则以此格式化
    second: '%H:%M:%S',                 // 如果时间轴以秒为单位,则以此格式化,其他同理
    minute: '%H:%M',
    hour: '%H:%M',
    day: '%m/%d',
    week: '%e. %b',
    month: "%b '%y",
    year: '%Y',
  },
  labels: {
    enabled: false,
  },
  tickLength: 0,
  lineColor: cssVar('--echart-axis-line'),
  lineWidth: 0,
},
问题三:如何渲染两个图?
如果想渲染类似这样的图,则有两种方案:1.混合图 2.单独渲染两个图
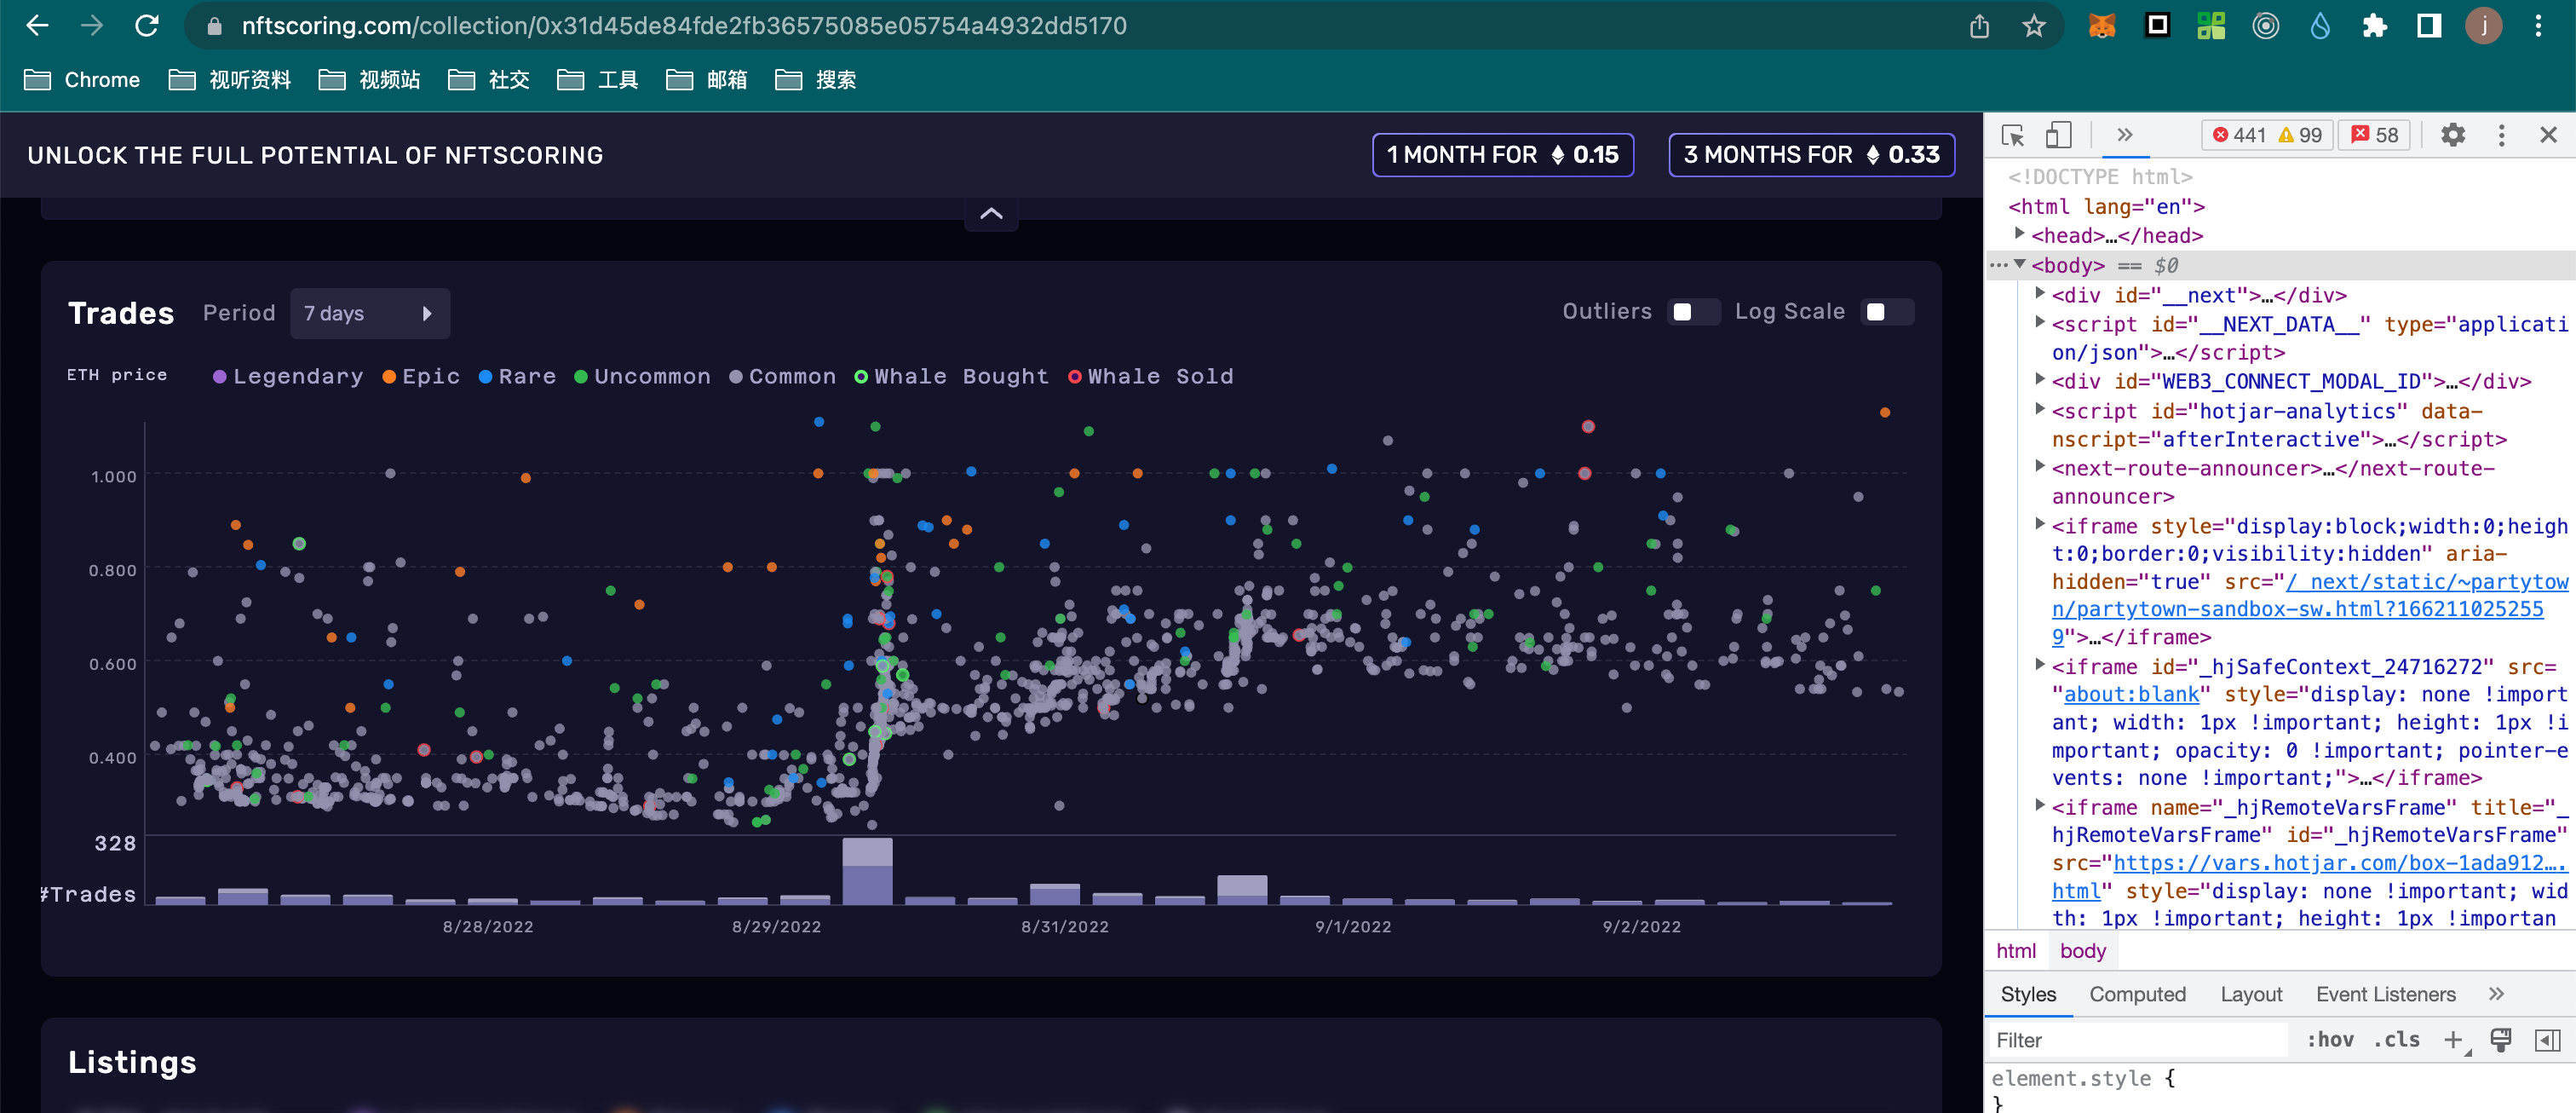
混合图缺点:
- 无多个图例,tooltip配置不方便,会共享配置
该图最好单独渲染两个图,实现思路:
子绝父相,并让一个图占70%,而另一个图占30%
<div class="fit relative-position">
  <HighChart class="absolute-full pos-scatter" :option="scatterOptions" />
  <HighChart class="absolute-full pos-column" :option="columnOptions" />
</div>
.absolute-full {
  top: 0;
  right: 0;
  bottom: 0;
  left: 0;
}

.pos-scatter {
  bottom: 30%;
}

.pos-column {
  top: 70%;
}
问题总结
合并多个配置
用
Highcharts.merge,例如:合并主题Highcharts.merge(theme.value, {
chart: {
marginLeft: 100,
}
})hover单个点,不弱化其他点
{
  plotOptions: {
    series: {
      states: {
        inactive: {
          // 选中时,其他系列不置灰
          opacity: 1,
        },
          hover: {
            enabled: true,
          },
      },
    },
  },
};
多个图轴对齐问题
多个图设置相同的
marginLeft{
chart: {
marginLeft: 100,
},
}数据量太大,散点图无法渲染问题
原因:如果series数据不是数组,那么会有数据限制,默认是1000,超过则不会渲染
{
  plotOptions: {
    series: {
      // 将其设置为更大的阈值,否则散点图不会渲染,默认为1000
      // https://stackoverflow.com/questions/15921399/highcharts-3-cannot-render-more-than-1000-points-in-one-series
      // http://api.highcharts.com/highcharts#plotOptions.series.turboThreshold
      turboThreshold: 5000,
    },
  },
};
如何更新数据
在highcharts-vue中只需要更新options即可自动更新图表
其他可通过chart实例更新
// 更新整个配置
chart.update(newOptions)

// 单独更新series,并重绘
chart.series[0].data.update(newData)
chart.redraw()